Chapter 2 Sample Surveys
A sample survey is an exercise in which data are collected from a sample (a subset) or a population. The data collected are used to create estimates of the characteristics or parameters of the population.
Some examples:
- A sample of voters are telephoned to ask their voting intentions, with the aim of predicting the outcome of the election;
- A sample of sites in a river catchment is tested for the presence of algae to determine the spread of the algae throughout the entire catchment;
- A sample of households is selected, and the residents asked about their employment status, in order to estimate the national unemployment rate.
A census is a special case of a sample survey in which every member of the population is surveyed.
2.1 The Survey Process
The different steps in the survey process are shown in Figure 2.1.
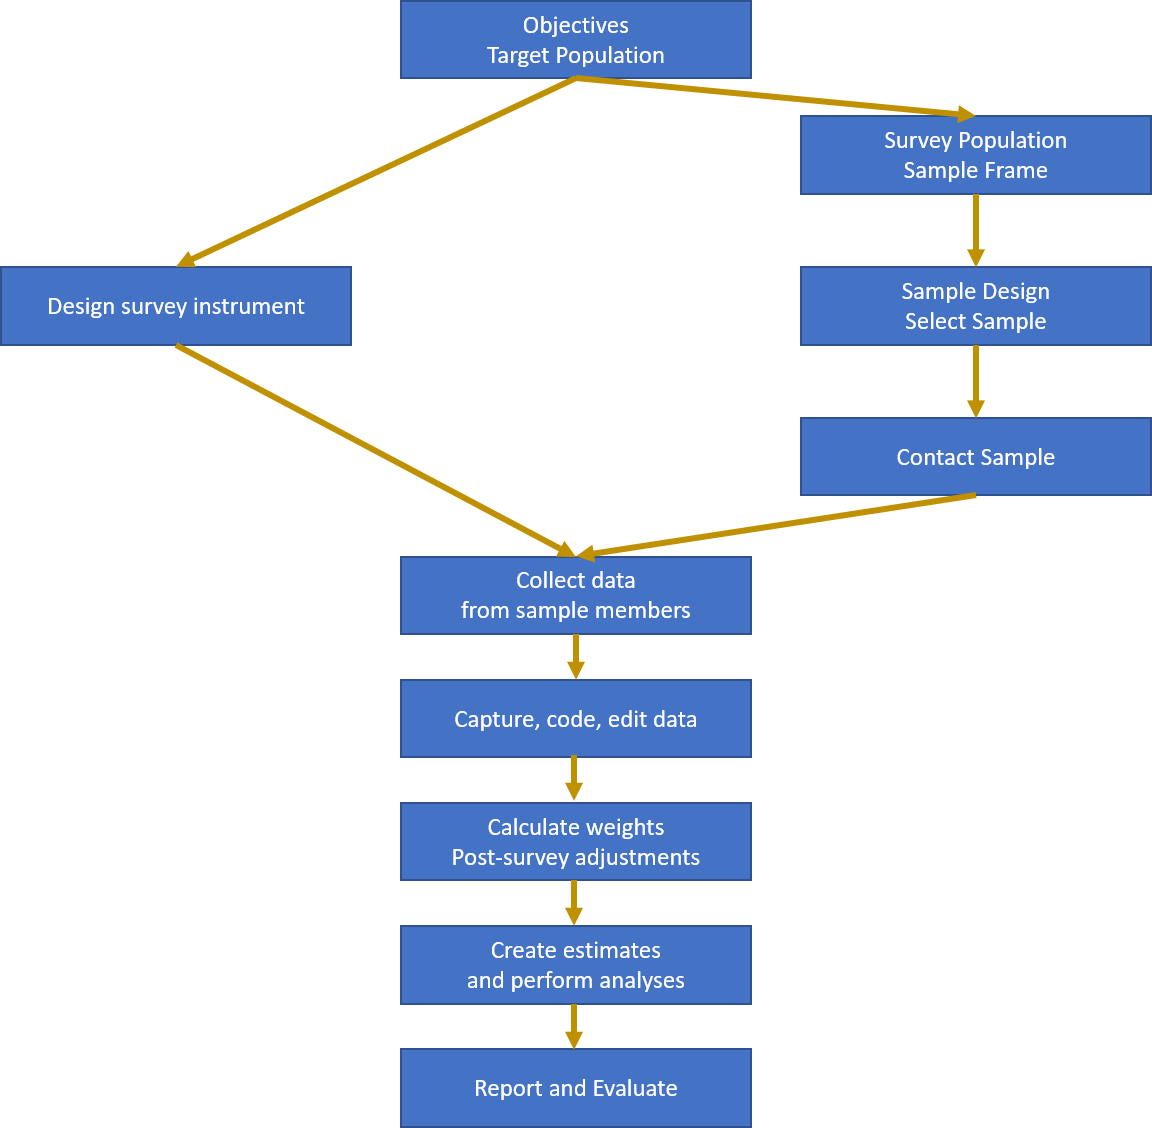
Figure 2.1: The Survey Process
- Every survey has a set of objectives – the particular populations which are of interest;
- These parameters are properties of the target population: the population about which estimates are to be made;
- Not all members of the target population are able to be identified: the ones that can be surveyed make up the survey population;
- The sample frame is a listing of all members of the survey population;
- The sample design is the method of selecting the sample from the frame. The sample size is usually decided as a compromise between the required accuracy of estimates and the survey costs and other constraints (e.g. the time available for the survey);
- survey instrument is the means of data collection. It is usually a paper or electronic questionnaire, completed by the respondent or the interviewer/observer. The instrument aims to measure the properties of the sample members which mean that the desired population characteristic can be estimated. The instrument must be valid (it must actually measure what it intends to measure) and reliable (repeated measurements of the same sample member under identical circumstances should always yield similar results);
- The sample members are contacted and recruited into the sample. Not all selected members will be able to be contacted (even after strenuous efforts), and some will not respond even if contacted;
- The data are collected from the sample members in some mode (e.g. face-to-face, telephone, web, observational, …);
- The data collected are captured (stored on a computer); coded (converted into standard classification systems); edited (checks for data consistency); and stored in a final dataset;
- The data may be adjusted, e.g. imputation or weight adjustments for nonresponse may be done;
- Estimates of the parameters of interest are constructed, and other analysis of the data is carried out (e.g. regression estimation, comparison with other data etc.);
- The results are summarised in a report;
- The original data may be archived in some appropriate form, or destroyed;
- A post-survey evaluation may be made to determine how well the survey met its goals.
For example: The Household Labour Force Survey (HLFS).
- One of the main objectives of the HLFS is to estimate the unemployment rate every quarter;
- The target population is the working age population of New Zealand;
- The survey population is the civilian, non-institutionalised usually resident population of adults aged 15+ living in permanent, private dwellings on the main islands of New Zealand (North Island, South Island and Waiheke Island);
- The sample frame is a list of dwellings created at the most recent census and regularly updated to reflect changes;
- The sample design is a stratified cluster design. Within each local government area a sample of small areas (PSUs) is selected. A sample of households is selected from within each PSU. Every adult from the selected households is surveyed. 15000 households and 30000 adults are surveyed every three months, in order to create unemployment estimates accurate to within \(0.5\)%.
- The survey instrument is an electronic questionnaire.
- The interviewers contact the households in person or by telephone, making up to 10 call backs to ensure contact is made. Proxy responses are permitted (i.e. one household member can respond on behalf of another). The interview takes place by computer assisted personal or telephone interviewing (CAPI or CATI).
- The results are post-stratified to match the current population estimates in each local government area;
- Estimates of the unemployment rate are published within about 6 weeks of the end of the quarter.
The following tables summarise the properties of three very different surveys (following a template by Groves et al., 2004).
2.1.1 Household Labour Force Survey
| Title | Household Labour Force Survey (HLFS) |
| Country | New Zealand |
| Sponsor | Statistics New Zealand |
| Collector | Statistics New Zealand |
| Purpose | To produce each quarter, a comprehensive range of statistics relating to the employed, the unemployed and those not in the labour force who comprise New Zealand’s working-age population. |
| Year started | 1985 |
| Target Population | The civilian non-institutionalised usually resident New Zealand population aged 15 and over |
| Sample Frame | Dwellings enumerated at the previous census and grouped into areas |
| Sample Design | Multistage, stratified clustered area probability sample of primary sampling units (PSUs); sample of dwellings within PSU drawn, all eligible adults within selected households |
| Coverage | Excludes households on offshore islands |
| Sample Size | 15000 households and 30,000 adults |
| Use of Interviewer | Interviewer administered |
| Mode of Administration | Face-to-Face (first) and telephone (subsequent) interviews for each household and each person |
| Computer Assistance | Computer assisted personal interview (CAPI) or telephone interview (CATI) |
| Selection Unit | Household |
| Reporting Unit | Household, person |
| Time Dimension | Ongoing rotating panel survey of dwellings |
| Frequency | Conducted quarterly |
| Interviews per Round of Survey | Each household is surveyed every three months over two years (8 times in all) |
| Levels of Observation | Household, person |
| Response Rate | Usually 90% |
| Web link | http://www.stats.govt.nz/ |
| Source | http://www.stats.govt.nz/datasets/work-income/household-labour-force-survey.htm |
2.1.2 Quality of Life Survey
| Title | Quality of Life Survey |
| Country | New Zealand |
| Sponsor | City Councils of NZ’s largest cities; Ministry of Social Development |
| Collector | TNS |
| Purpose | To provide information to decision-makers to improve |
| the Quality of Life in major New Zealand urban areas | |
| Year started | 1999 |
| Target Population | Residents of the largest New Zealand cities |
| Sampling Frame | Electoral Roll |
| Sample Design | People were selected from the electoral roll; addresses matched to phone numbers; rang phone numbers and asked for person with the next birthday. Quota sampling within electoral wards (quotas by age, sex, ethnicity) |
| Coverage | Excludes households with no landline telephone |
| Sample Size | 7720 achieved interviews |
| Use of Interviewer | Interviewer administered |
| Mode of Administration | Telephone interview |
| Computer Assistance | Computer assisted telephone interview (CATI) |
| Selection Unit | Household |
| Reporting Unit | Person |
| Time Dimension | Repeated Cross sectional survey, (most recent 2006) |
| Frequency | Once |
| Interviews per Round of Survey | One |
| Levels of Observation | Person |
| Response Rate | 22% |
| Web link | http://www.bigcities.govt.nz/ |
| Source | http://www.bigcities.govt.nz/ |
2.1.3 Survey of Hector’s Dolphins between Motunau and Timaru
| Title | Survey of Hector’s Dolphins between Motunau and Timaru |
| Country | New Zealand |
| Sponsor | Department of Conservation |
| Collector | Department of Conservation |
| Purpose | To measure the abundance of Hector’s Dolphin (Cephalorhynchus hectori) between Motunau and Timaru in 1998. |
| Year started | 1998 |
| Target Population | Hector’s Dolphin between Motunau and Timaru |
| Sampling Frame | Line transects taken with 4 nautical miles of the coast between Motunau and Timaru |
| Sample Design | Line transects in four strata (Akaroa Harbour; other large bays on Banks Peninsula; Inshore zone (<4nm from shore); offshore zone (4-10nm)) |
| Coverage | Excludes dolphins far offshore |
| Sample Size | Transects 1 nm apart within harbours and bays; 2 nm apart in Marine Mammal Sanctuary; 4nm elsewhere. 4 replicate surveys. |
| Use of Interviewer | Left and Right Observers on 15m catamaran |
| Mode of Administration | Observational, using seven-power binoculars |
| Computer Assistance | Third observer enters into palmtop as collected |
| Selection Unit | Transects; Dolphin Groups |
| Reporting Unit | Dolphin Groups |
| Time Dimension | Two month observation period |
| Frequency | Once (may be repeated in future) |
| Interviews per Round of Survey | One |
| Levels of Observation | Dolphin Groups |
| Response Rate | |
| Web link | http://www.doc.govt.nz/ |
| Source | Dawson et al. (2000) ‘Line-transect survey of Hector’s dolphin abundance between Motunau and Timaru’; DoC report. |
2.2 Survey Error
At the end of a sample survey analysis we will have an estimate \(\widehat{T}\) of a population parameter of interest \(T\). For example \(T\) might be the unemployment rate in the December quarter, and we find from the HLFS the estimate \(\widehat{T}=3.8%\).
We can be pretty sure that the true unemployment rate isn’t exactly 3.8%, but we expect it to be close to this. The difference between our survey estimate and the (unknown) truth is called the survey error: \[ \text{Survey Error} = \text{Estimate} - \text{Truth} = \widehat{T}-T \] The value of the error is unknown to us (because the truth \(T\) is unknown), but it is useful to think about what factors contribute to the error, and what effects those factors have. The points at which the different survey errors enter the survey process are shown in Figure 2.2.
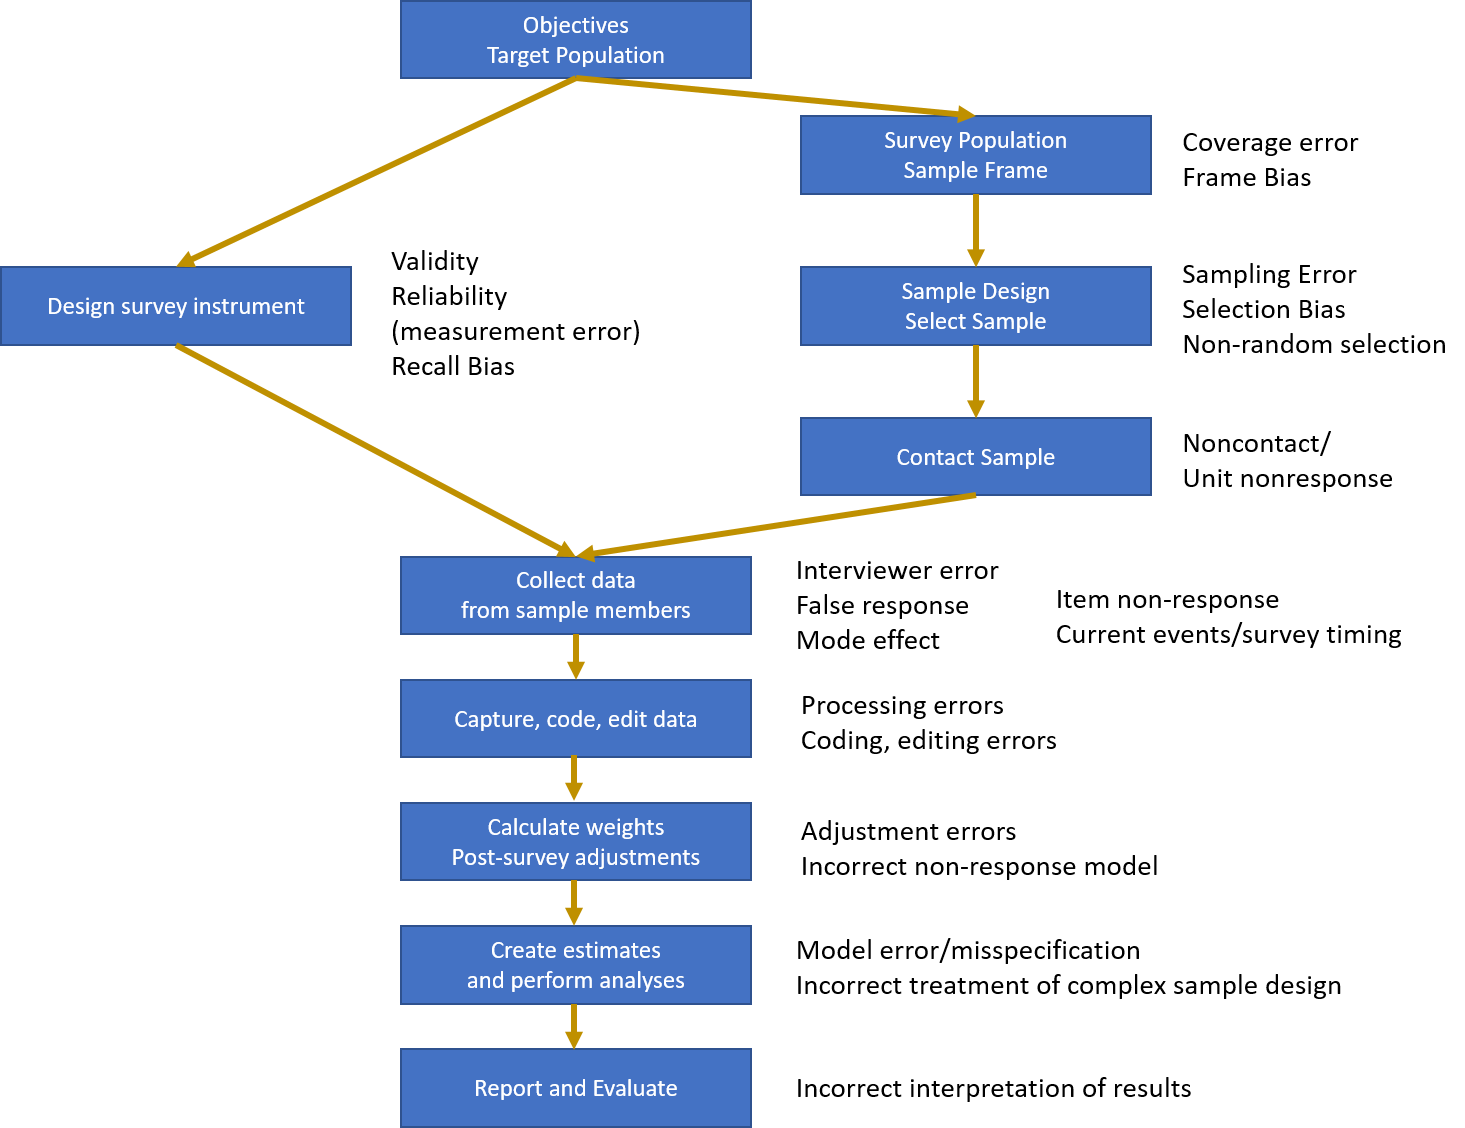
Figure 2.2: Sources of Survey Error
The error sources in the diagram are usually divided into Sampling Errors and everything else: i.e. Non-sampling Errors. The reason for this is that only sampling error can be properly quantified and allowed for using statistical theory. All of the other types of error need to be controlled and minimised as far as possible, and these are generally unquantifiable. There are methods for reducing the effect of some of these errors, but most such adjustments rely on assumptions that are untestable.
2.2.1 Sampling Error
Sampling error is the error which is the result of collecting information from only a subset of the population, rather than the whole population. Thus censuses have zero sampling error by definition. Sampling error is caused by the variability in the responses across set of possible samples from the population.
The extent of the sampling error depends on many factors, including:
- Sample size: increasing the sample size reduces the sample error, although there is a point beyond which little practical gain is made by further increasing the sample size.
- Variability of the characteristic of interest: the greater the variation in the population, the greater the sampling error.
- Sample design: designs which use known population characteristics may reduce the sampling error by targetting the sampling most efficiently.
2.2.2 Non-Sampling Error
Non-sampling error includes all other sources of error. Almost every step in the survey process is a potential source of non-sampling error, but the size of the error is often not easy or impossible to measure, and may be larger than sampling error.
Non-sampling errors may be related to:
- Frame bias/coverage error: the sample frame which does not match the target population
- Non-random sample selection
- Non-response or false response
- Poor questionnaire design, leading questions, measurement error
- Interiewer error
- Data entry, processing, coding, editing errors
- Post-survey adjustment errors
- Model misspecification in analysis
- Incorrect treatment of data from a survey with a complex design
2.2.3 Examples
Invalid Instrument
Australian National Referendum question:
Do you approve the proposed law to alter the Constitution to establish the Commonwealth of Australia as a republic with the Queen and Governor-General being replaced by a President appointed by a two-thirds majority of the Members of the Commonwealth Parliament?
This is two questions in one – the question does not address support for a republic in Australia, but only support for a particular model. 45% said yes to this question.
Invalid Instrument
Referendum question at the 1999 New Zealand general election:
Should there be a reform of the justice system placing greater emphasis on the needs of victims, providing restitution and compensation for them and imposing minimum sentences and hard labour for all serious violent offences?
Almost 92% of the population answered yes. But what question where they answering? There are 5 questions here! In fact they were probably just answering the question ‘Are you worried about violent crime?’
Coverage Error and Non-response Bias
The Literary Digest magazine ran a postal poll of 10 million people selected from phone books and car registration lists before the 1936 US election. It received a response rate of 23% (2.3 million responses), and incorrectly predicted 55% support for Alf Landon (Rep.) over the incumbent F. D. Roosevelt (Dem.) (41%).
The actual result was 37% for Landon, and 61% for Roosevelt.
George Gallup polled 5,000 people, also by post, but balanced the demographics of his sample. He predicted 54% for Roosevelt, and also predicted that the Literary Digest would get the result wrong.
The Literary Digest made two mistakes:
- Coverage Error - the sampling frame (car owners and phone users) was more affluent than the general population (more likely to vote Republican);
- Non-response Bias/Non-random selection - people wanting change (i.e. a Republican victory) were more likely to respond.
The Literary Digest, having previously been a highly successful polling organisation, went bankrupt the next year.
In 1948 the Gallup organisation overconfidently stopped polling 2 weeks before an election, missed a dramatic late shift in public opinion, and called the election incorrectly: predicting Harry S Truman would be defeated.