Chapter 5 Populations and Frames
\(\DeclareMathOperator*{\argmin}{argmin}\) \(\newcommand{\var}{\mathrm{Var}}\) \(\newcommand{\bfa}[2]{{\rm\bf #1}[#2]}\) \(\newcommand{\rma}[2]{{\rm #1}[#2]}\)
The target population defines the scope of the survey: the set of units which make up the population in which we are interested.
The sample frame is a method of gaining access to the members of the target population. It is an actual or conceptual list. However it may not be perfect (Figure 5.1).
- Not all members of the target population will appear on the sample frame: the missing units are out of coverage;
- Not all units listed on the sample frame are members of the target population: the extra units are out of scope.
- The survey population are those units which are both in the target population (in scope) and on the frame (in coverage).
Our aim is to have a sample frame which covers most if not all of the target population, and which has only very few out of scope units.
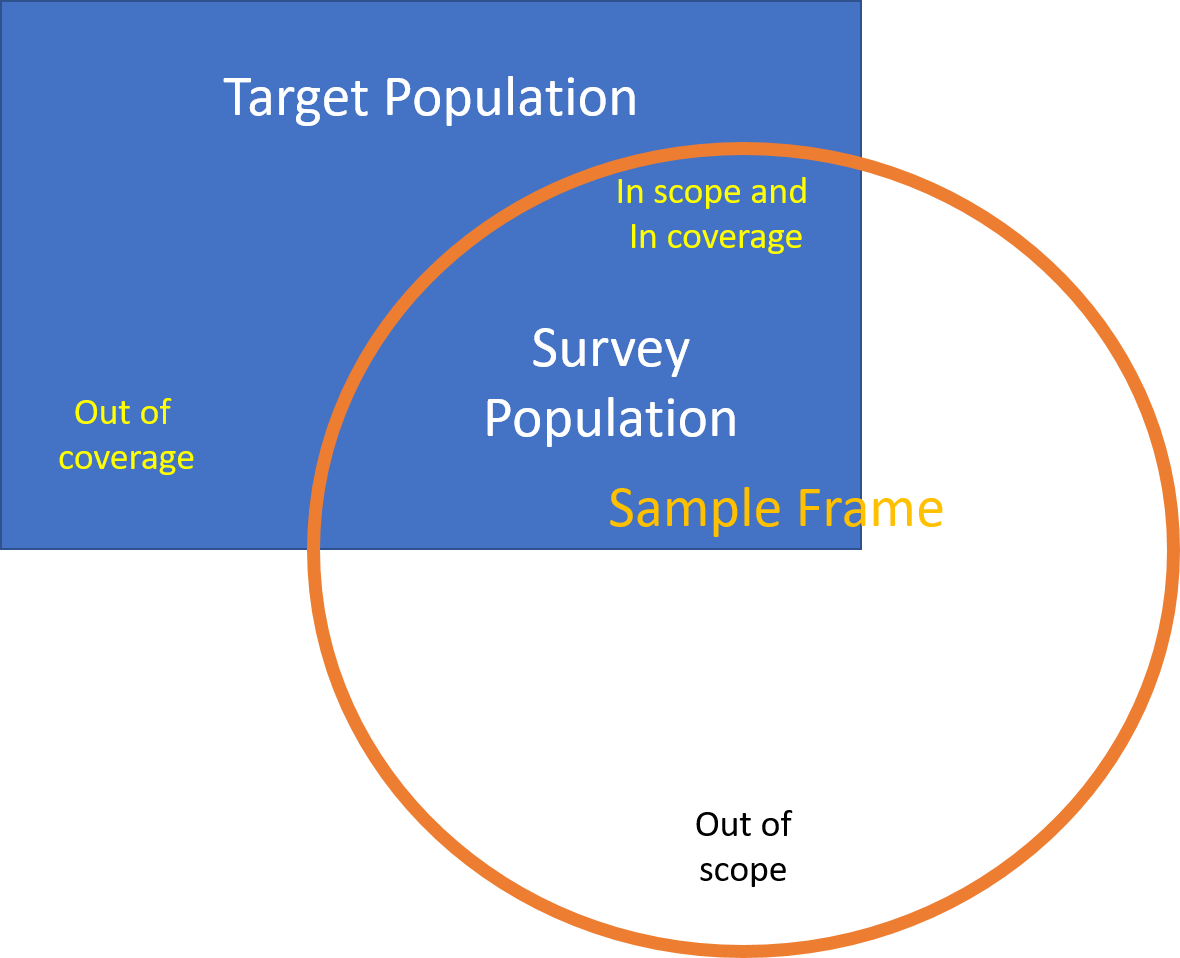
Figure 5.1: Scope and Coverage
5.1 What is a sampling frame?
The sampling frame is a key element in the survey process which provides the basis from which a random (probability based) sample can be selected. The purpose of having a sampling frame is to enable each member of the target population a nonzero probability of being selected to participate in the survey. The quality of the data, from a survey which has as its basis a comprehensive frame, can be measured and controlled.
The term sampling frame is sometimes misunderstood, often being thought of as a list containing each member of the population. In fact that is more a description of an `ideal’ sampling frame. The best way to show what a sampling frame can be in practice is to examine some examples:
List Frames. Good up-to-date lists make ideal frames. However lists of units (electoral rolls, telephone listings etc.) are generally formed for purposes other than for use as sampling frames. For this reason they are often not close to `ideal’ sampling frames. Some discussion of list frame problems comes later.
Multi-stage Sampling Frames. These frames consist of a set of lists which are arranged in a hierarchy of stages. For example a typical household survey frame will be organised like so: The first list is a a set of non-overlapping geographic areas from which a sample of areas is taken. For example we may list all the local regional councils and take a sample of them. Within these areas we might then list all the households and take samples from the household lists. From each household we would then list the residents and interview selections of them. Note that we do not have to list the entire population. The only comprehensive list needed is the list of the areas which will be quite small. By giving each area a chance of being selected we ensure each person living in each area has a chance of selection.
Continuous Sampling Frames. Consider the population of people entering a country from international flights. Suppose we choose a random number between one and ten (\(=k\)) and then interview the \(k\)th, \((k+10)\)th, \((k+20)\)th … persons who file through customs. We will have a sample where every person has had a 1 in 10 chance of being selected. But what is the frame? There is no list. We call such a situation a `conceptual list’, where the people filing into the country effectively formed a long queue of people which we have treated like a listing of the population, although a listing of names was never constructed. \end{description}
One can find many different definitions of sampling frames. The following is a simplified definition that should serve our purposes:
A sampling frame is part of the system of rules and procedures used when determining who is to be surveyed and which ensure that each member of the population get some measurable (non-zero) chance of participating in the survey.
The examples above show that we need to think beyond the concept of a list of units, whose construction is a separate exercise from the other survey stages.
5.2 What is a good sampling frame?
We will often have several frames available and will have to decide between different options. To help us with this decision we need to be a little more specific about what makes a good sampling frame. The first thing we should consider is the effective coverage of the sampling frame. This can be determined by testing it for the following properties:
Each unit should be counted at least once. If there are missing units (out of coverage) then the survey results may be biased if the excluded units tend to be different to the units which are included.
Each unit should be counted only once. The problem is that we usually can not tell how many times a unit is duplicated. This means we can not tell how many chances a unit has of being sampled. This can cause similar bias if the units which are duplicated are different to the other units. The results will be biased towards the duplicated sub-group of the population.
Each unit should be distinguishable from the other units on the frame. If we select a unit from the frame (say Jane Smith) but then can not tell who this refers to, when there are many Jane Smiths in the population, then the frame has not done its job.
Should provide up-to-date information about the units. For example it if it claims to provide Jane Smith’s address it should be the current address.
No units should be there if they are not meant to be. Extra units (out of scope) are not a serious problem unless we fall into the elementary error of replacing them whenever we come across them in the sample. This confuses selection probabilities. The correct procedure is to drop any ineligible unit found in the sample and not replace them.
Should allow direct access to each unit. Ideally the frame will ultimately supply us with a list of the units we are interested in analyzing. Sometimes a frame will only give samples of groups of units e.g. a list of addresses, each of which may contain many people. Further work is needed before a sample of people is realized.
5.3 Screening
Note that sometimes the units in the survey population do not have a natural frame and we need to use a frame with large numbers of ineligible units and perform screening. For example, many surveys in New Zealand require separate estimates for Māori people as well as for the whole population. There is no population register of Māori, and the only way to find a sample of sufficient size is to take a screening sample: i.e. a large number of households are selected and approached. A set of screening questions is administered to determine whether there are any eligible Māori living at the selected dwelling. If there are, then an interview is carried out, but if not the residents are thanked for their cooperation, but are not interviewed. Thus in general only a small proportion of a screening sample is actually used, since only a small proportion of units in the screening sample are eligible.
Screening may also apply to subsets of questions in a questionnaire: only certain respondents answer certain questions. For example, in the New Zealand Health Survey a set of screening questions about gambling behaviour establishes whether or not the respondent will be asked a set of questions related to the risk of problem gambling. When estimates are made about the characteristics of problem gamblers (e.g. proportion male/female; age distribution etc.) then only this restricted, screened, subsample is used because these estimates relate to a restricted subpopulation of the survey population of the whole NZ Health Survey.
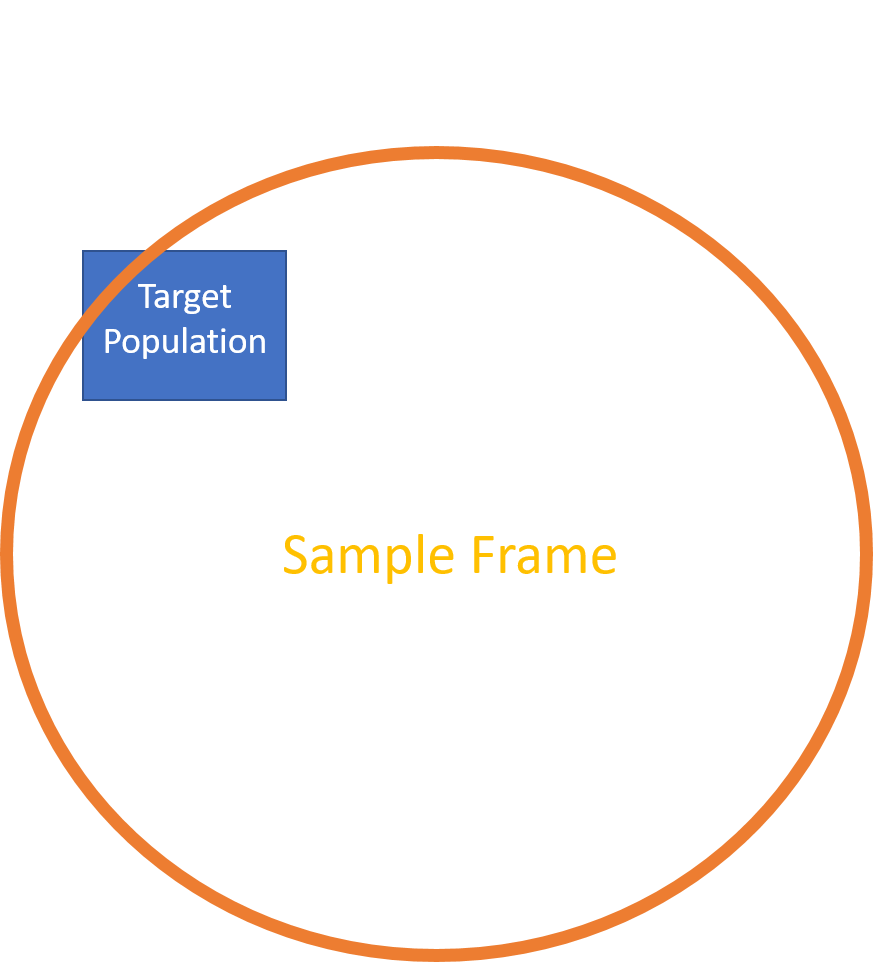
Figure 5.2: Screening. The only available sample frame is dominated by ineligible (out of scope) units
5.4 Why does a frame need to be so comprehensive?
Good sampling frames help us make our surveys similar to good scientific experiments in the sense that they help us remove the effect of unknown factors on our conclusions. How?
We can show that if we miss units or count them twice our estimates derived from the survey data will be biased estimates of the population values and that the magnitude of the bias will be unknown. This means our inferences about the population may be incorrect.
To discuss this further it will help to define the target population which contains all the units we want the survey to represent and the survey population which contains all the units covered by the survey frame. A sample frame will generally be able to cover only a subset of the target population. The difference between the target and survey populations is called the frame bias and is most significant when those not covered by the frame are large in number and different to the remaining population. In fact we can show that frame bias is product of two factors \(P\times D\) where:
- \(P=\) The proportion of the target population not covered by the frame.
- \(D=\) The difference between those covered by the frame and those not. For instance this might be the difference between the average heights of those on the frame and those not on the frame.
In most cases \(D\) is unknown so that the best approach, to minimize the bias, is to keep \(P\) as small as possible. In other words unless we have a comprehensive frame our surveys results will be biased by an unknown amount.
Example. Assume we are estimating the mean house price in New Zealand. We have an incomplete frame, containing \(N_1\) units (houses), but there are \(N_2\) units missing. The total number of houses in NZ is thus \(N=N_1+N_2\).
Now assume that the mean price of the \(N_1\) houses on the frame is \(\bar{Y}_1\), and the mean price of the \(N_2\) missing houses is \(\bar{Y}_2\). The mean price of all houses is then
\[ \bar{Y} = \frac{N_1\bar{Y}_1+N_2\bar{Y}_2}{N} \]
If we let \(P=N_2/N\) be the proportion of houses missing from the frame, and \(D=\bar{Y}_1-\bar{Y}_2\) be the difference in the mean prices for houses on and off the frame we can write
\[\begin{eqnarray*} \bar{Y} &=& (1-P)\bar{Y}_1+P\bar{Y}_2\\ &=& \bar{Y}_1 - P(\bar{Y}_1-\bar{Y}_2)\\ &=& \bar{Y}_1 - PD\\ \end{eqnarray*}\]
Thus a sample estimator which estimates \(\bar{Y}_1\) will have a bias: \[ {\rm Bias} = \bar{Y}_1-\bar{Y} = PD \]
Assume that \(P=\frac13\) of the houses are missing, and that \(\bar{Y}_1=\$750,000\) and \(\bar{Y}_2=\$300,000\). The bias is then \(PD=(\$750,000-\$300,000)\times\frac13=\$150,000\): i.e. we estimate the mean house price to be \(\bar{Y}_1=\$750,000\), but this is an overestimate, which is too large by \(150,000. In a less extreme case if\)P=0.01$ (i.e. 1% of houses missing from the frame) the bias is \(PD=(\$750,000-\$300,000)\times0.01=\$4500\).
5.5 Costs, Design and Operation - further complications.
Apart from the effective coverage of the population, there are a number of other issues which may determine which frame we can or should use. These include cost, survey design and survey operations.
If a good (complete and up to date) list exists then using this list will be the cheapest alternative. Constructing a complete list from scratch will be expensive in terms of the time it will take and the amount of work required. However updating a list is often just as expensive as constructing it from scratch, thus old lists are often not of much use. In many circumstances an area-based hierarchical frame will be less expensive because only the members within the sample at each stage need to be listed. A complete listing will only be needed of the groups of units at the initial stage. This stage will generally only be a list of areas or maps and will not require costly detailed listing of individual units. An area-based frame can save costs, because it will limit sampling to a number of areas. This means, for example, the time and effort required to travel to each selected individual unit will be smaller than if the selected units are spread over the whole population.
The choice of sample design can be limited by the frame. Two aspects of the sample design involving the frame are: Stratification and Cluster Sampling. Stratification involves sorting the list of units into a set of distinct groups and then selecting samples independently from each group. This process requires that we have a frame which we can easily rearrange and separate into different groups. Thus we need some flexibility and control over the ordering of individual units. An area-based frame means we could only stratify the areas and could not stratify the households or people.
Frames which do not allow us to directly select individual units mean that we are using cluster sampling. An example is a two-stage selection of people, where we initially sample households and then obtain a selection of people from the selected households. Clustering of the units prior to selection tends to increase the variances of the resulting survey estimates. This is usually tolerated because of cost savings, which are discussed briefly above.
The choice of frame affects the operation of the survey. Consider the example of a continuous sampling frame used for a sample of overseas departures. We may know that by having each person file through customs we can conceive a valid comprehensive sampling frame, with each person receiving a fixed chance of being selected. However if the questionnaire we need to use takes up to an hour to complete and is impracticable to use at such a site then we will need to consider an alternative survey procedure (including an alternative frame). We can never consider the choice of sampling frame to be independent of the operational side of the data collection.
| Source | Undercoverage | Overcoverage | Duplicates |
|---|---|---|---|
| Telephone Register | No landline phone; upaid bills | businesses and other non-private addresses | two phones in one dwelling; number listed against two names |
| Electoral Roll | Never registered; New arrivals to the electorate; aged <17 | deceased people; people who have left | registered twice under two names; listed in two electorates; multiple electors per dwelling (if usng to select addresses) |
| Address Lists | New houses; subdivided houses; hard to find; isolated rural dwellings | businesses and other non-private addresses; vacant sections; abandoned/empty dwellings; holiday homes | houses on two street lists (e.g. corners) |