Gallery 4
Page: 1 | 2 | 3 | 4 | 5 | NEXT
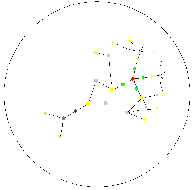 Image 31 - Fisheye view of 4 dependency trees.
The red center node is artificial and is introduced to connect the otherwise disjoint trees. Second version.
Play with the applet.
Relevant references: FishEyeBean[FEB] [HP] [NLMHP] [EBIHV]
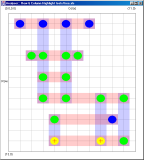 Image 32 - Row and column thatching.
This visualisation is a modifed version of the Cell Classification visualisaiton.
In addition to the prior infomation, rows and columns are highlighted between the first and last occupied cell.
That is, for any particular row (or column), a shaded rectangle is drawn from the first occupied cell to the
last occupied cell. If no occupied cells exist in the row (or column), no rectangle is drawn.
This particular example uses the same spreadsheet as Image 16.
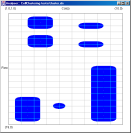 Image 33 - Simple cell clustering for a single worksheet.
This visualisation provides a simple alternative to the more complex
BIRCH Clustering (Images 18, 19) visualisations.
Each occupied cell is displayed as a circle. If and adjacent cells are also occupied, a coloured rectangle is
placed on the corresponding edge. The end result of this is that adjacent cells appear to be one large blob
(or cluster).
Its all a bit crude, but strangly effective in my own opinion.
The same information using BIRCH clustering is available in CellCluster_alt.png
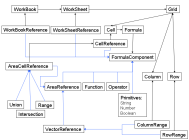 Image 34 - UML Spreadsheet Structure.
First draft of UML Spreadsheet Strucutre. Missing arties. Inheritance is done using blue arrows.
Much more advanced than the older version.
Version 2 becomes more realistic, as it allows for Union's and Intersection's to be composed of any two AreaReferences.
See also Excel.
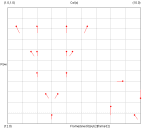 Image 35 - Spreadsheet Swarm Animation.
As animated spreadsheet visualisation showing the flow of information between cells created by formula. In this case the flow is shown from root cells towards the leaf cells. The length of the trail can be used as an indication of the distance being spanned.
This particular example uses the same spreadsheet as Image 16 and offers an alternative view to that of Image 29.
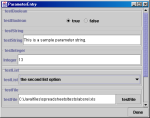 Image 36 - Java GUI Parameter Entry.
This is a class I made that allows you to collect the parameters you require via a GUI. You pass in the type of parameter (Boolean, Integer, File with extension, etc...) and once the user hits done you can read the results back using a tag lookup.
 Image 37 - Tabbed spreadsheet viewer.
This tool shows the contents of a spreadsheet using a tabbed pane for each worksheet. Clicking in a cell will display the formula in the formula bar if one exists.
I hope to extend this tool to allow for interactive visualisation of worksheet strucutre in an environment that is very similar to Excel.
This particular example uses the same spreadsheet as Image 16
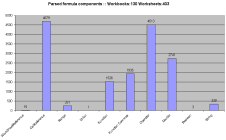 Image 38 - Corpus analysis of parsed formula components.
This graph shows how many times each formula component type was parsed in a test corpus of 130 workbooks. Formula components that have a 0 count don't appear.
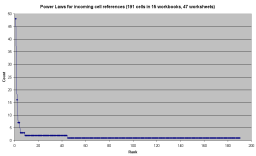 Image 39 - Corpus Analysis of incoming cell reference power laws.
This first test of the power law analyser on 15 workbooks suggests we may be able to find power laws in spreadsheets. Cells with no incomming references (of which there are many) are ignored.
Also available with a log scale.
See also [PL].
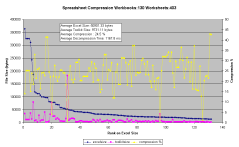 Image 40 - Corpus Analysis of Spreadsheet Compression in the toolkit.
This test shows that by zipping a WorkBook before writing to disk the toolkits files becomes significantly smaller (a 1/4 on average).
This also results in them being smaller than those using the BIFF, with a few exceptions.
For the 130 workbooks used the average time reading the zipped information was 1163 ms. However, this high average is mainly due to a few spikes created by a couple of spreadsheets that for some reason take an extremely long time to decompress.
Also available with a Decompression Time analysis.
Page: 1 | 2 | 3 | 4 | 5 | NEXT
