Corpus Analysis of Spreadsheet Dependency Structures
Honours project for Daniel Ballinger
Supervisors:
Robert Biddle and
James Noble
robert@mcs.vuw.ac.nz, kjx@mcs.vuw.ac.nz
30 May 2002
This document is available online at http://www.mcs.vuw.ac.nz/~elvis/db/progress.html
Due 31 May 2002
Contents
- Introduction
- Project Web Site
- Background Reading and Research
- Corpus Analysis
- Visualisation
- The Excel file format
- HTTP 1.0
- Tools in Development
- Reference Information Management System (RIMS)
- Gobbler - Rapid automated corpus identification via keywords and search engines.
- Fetcher
- Extractor
- Analyser
- Doodler
- Screenshots
- Future plans
- Cross Platform Java Components
- Metrics for Spreadsheets
- A Set of Visualisations
- Large Scale Testing
- References
- Web site references
- Glossary
1. Introduction
This honours project involves applying program visualisation techniques to a corpus of spreadsheets to do an empiricist analysis of the dependency structures and layout patterns/organisation. More specifically, the aim is to investigate styles and approaches used by people to in programming visual spreadsheets, such as Microsoft Excel. As Chomsky observed about corpus linguistics [NC], this is measuring user performance with spreadsheets rather than actual user competence. The visualisations created will be targeted at revealing interesting aspects of naturally occurring data within spreadsheets.
2. Project Web site
A web page exists for my research project where I post updates on where I am
in my project, references, screenshots and the current abilities of the code.
http://www.mcs.vuw.ac.nz/~elvis/db/honours.html
3. Background Reading and Research
The complete set of background reading I've done can be found on the web site reference engine (RIMS) mentioned below.
3.1 Corpus Analysis
This relates to phase 2 - Research into the principles of Corpus Analysis of the project proposal.
To help track the information found about corpus analysis and linguistics I have created a page to store relevant information: http://www.mcs.vuw.ac.nz/~elvis/db/FishBrainWiki?Corpus.
I have found and read several books and web pages related to corpus linguistics and analysis. One of the most useful was Corpus Linguistics by Tony McEnery and Andrew Wilson [CL-Ed]. This book provided a good introduction to
- Early Corpus Linguistics and the Chomskyan Revolution
- What is a Corpus and What is in it?
- Quantitative Data
- The use of Corpora in Language Studies
Techniques that I develop to collect the corpus will need to be accessed on sampling and representativeness of the population.
I have a feeling that there is a significant difference between corpus linguistics and the style of corpus analysis I will be undertaking. There are strong grammatical rules and dictionaries in language and part of what is done in corpus linguistics involves looking for possibly new rules or words and proof of usage for existing rules and words. A spreadsheet, being a computational entity in the form I will be using it, is (in theory) strongly defined and limited by the environment it is programmed into. That is, the programmers decide what the language can and cannot do. However, almost all software has bugs, undocumented features, backdoors and hacks (especially larger programs like Excel) that allow them to do things not envisaged at the time they were designed and programmed.
I suspect language has a more flexible form of evolution than software. People are free to invent new words where as programs usually required structured and planned change. Changes in software will also mainly occur in bursts as new versions are released.
3.2 Visualisation
I have read several papers and books involving visualisation. Some of the more influential ones include the work done by James and Robert with the Nord Modular Patch Language [VVP] [PVVP] and the classical work of Jacques Bertin [SOG]. Several of the initial visualisations produced (below) are based on those that appear in the former two papers.
As my process for corpus analysis matures I will undertake further research into the possible visualisations. Another book, suggested by my supervisors, to be read is Readings in Information Visualization : Using Vision to Think [RIV].
The following relates to phase 3 - Deciding on a visualisation tool suitable (flexible and powerful enough) for creating diagrams with of the project proposal.
I've researched several tools that would aid in displaying the information generated. One of the main tools used so far is VisAD (an acronym for "Visualization for Algorithm Development") [VisAD], which is a Java Component Library for interactive analysis and visualisation of numerical data. VisAD is a powerful (and sometimes complex) visualisation tool with the ability to display data in a range of forms. It makes use of the Java3D environment to allow 3D data to be displayed.
VisAD has a powerful utility called a spreadsheet (this name will could lead to some confusion). Like an Excel spreadsheet, it has columns and rows of cells. Each cell can contain a visualisation and, via formulas, combinations of other cells can create new visualisations. Data can be loaded in from a large range of formats including comma-separated values (CSV).
3.3 The Excel file format
The following relates to phase 4 - Finding a format to convert spreadsheets to that will make producing diagrams easier of the project proposal.
There are ranges of techniques available, both commercial and open source, to process and convert the Microsoft Excel file format. To keep the programming consistent, the target format was to be readable by Java. The tool used had to be able to extract the complete range of occupied cells in a workbook, and distinguish the separate worksheet layers. For each cell it was required that the value and formula could be extracted.
A JavaBean called ExcelAccessor by IBM Alphaworks was chosen and is described below with the discussion of the Extractor tool.
3.4 HTTP 1.0
In the development of the corpus collection tools I needed to inspect the HTTP 1.0 RFC to allow the program to communicate with web based search engines [RFC1945].
4. Tools in Development
4.1 Reference Information Management System (RIMS)
To effectively manage the references used throughout my project I have developed a web-based reference tool. The tool is capable of recording the relevant details of any reference, such as, title, author, ISBN for a book, etc. Other features include images, a rating system, sorting and ordering capabilities, quotes, static HTML generation, hyper-linking to resources, web-based submission of new references, and local caching of documents.
RIMS was written in JavaScript so it could be used independently of a web server (cached locally on the users computer). I feel this flexibility is important, especially for myself, and is why I didn't use a server side technology like Perl with CGI.
RIMS is online at http://www.mcs.vuw.ac.nz/~elvis/db/reference.html.
For those with a JavaScript challenged browsers try the static version at http://www.mcs.vuw.ac.nz/~elvis/db/ref_lite2.html
but note that this may not be up to date.
Java Programs
All the tools that follow were developed in Java2. Several of them, like Gobbler and Doodler, may be renamed in the future to more descriptive names.
4.2 Gobbler - Rapid automated corpus identification via keywords and search engines.
Gobbler corresponds to phase 1 - the acquisition of spreadsheets - in the project proposal.
Gobbler is an automated corpus collection tool that uses keywords and a search engine to gather URLs for Excel files located on the Internet. Google was chosen for the search engine due to its ability to narrow results to excel files by simply appending the argument "filetype:xls" to the search terms.
The process undertaken is simply an automated version of how it would be done manually. The search terms and filetype:xls argument are passed to Google. The URLs are extracted from the resulting page and appended to the results found so far. The process continues until the target number of results is reached or Google reports no more results are available. All the URLs found are stored in a file with the search terms used for the filename.
The first working version used an HTTP 1.0 GET command [RFC1945], like a web browser would, to retrieve the HTML page from Google. This resulting page was parsed and the URLs extracted along with the estimated number of results. This technique in not ideal as it may be in violation of the terms of usage for Google.
In mid-April Google released their beta web Application Programmer's Interface (API) [GWAPI] that communicates via the Simple Object Access Protocol (SOAP), an XML-based mechanism for exchanging typed information, with the over 2 billion Web pages Google indexes. With some modification to the existing Gobbler, a second search method was added supporting the more legitimate Google API. A key is required from Google to use this service.
Issues about the quality of the corpus generated using this technique still need to be investigated and resolved, including sampling and representativeness.
4.3 Fetcher
Fetcher performs the simple task of retrieving the URLs stored by Gobbler and storing the Excel files in a directory with the search terms for the directory name. To improve bandwidth utilisation on high-speed connections it is multithreaded.
Web Proxy
To make Gobbler and Fetcher compatible with the MCS computing environment they needed to have authentication ability with the school web proxy added. This involved using a patch for the Google API (by Patrick Chanezon) as the beta release didn't have support for this.
4.4 Extractor

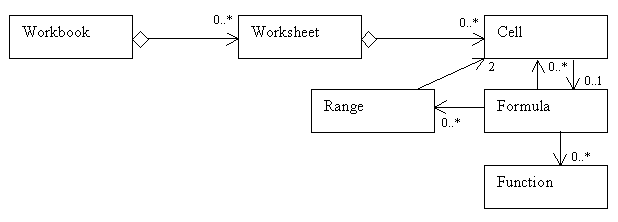
Figure 1: The Simple Spreadsheet Model.
Extractor uses the IBM ExcelAccessor JavaBean [EA] to read the contents of Excel files into an internal representation based on strings, vectors and integers. This internal form can be serialised and written out to the disk to make future processing faster (and platform independent). The bean uses native code within a Windows Dynamic Link Library (DLL) and hence will not work directly within the university Unix environment.
The parsing of formula in String format into Cell, Range, and Function objects is done using regular expressions. Java 1.3.1 doesn't have built in support for regular expressions so I've used the GNU package [REJava].
The following two software components form phase 5 - Creating a series of visualisations that will help reveal interesting properties of spreadsheets of the project proposal.
4.5 Analyser
Analyser incorporates all the different styles of corpus analysis that can currently be done on spreadsheets. Most often this involves iterating on the Java representations of workbooks that Extractor creates. The workbooks are usually passed to specialised analysis methods that are targeted at the style of analysis desired.
In support of Analyser are the MathVector and Grid classes.
MathVector is a representation of mathematical style vectors, in 3D space, with a starting point and magnitude. It also provides methods to find average vectors.
The Grid is currently a data storage component that allows for quick and easy access to a dynamically scaleable array. Grid objects have the ability to output the data they contain into a format suitable for use by Doodler (like comma separated values).
4.6 Doodler
Several styles of display have been generated so far.
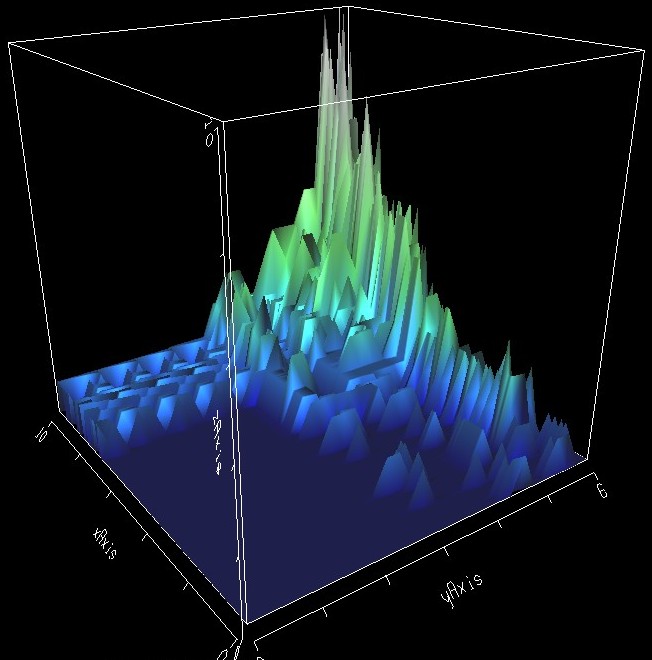
Firstly, a topographical display style for showing things like cell occupancy levels was created. It should be noted that this discrete data should not really be displayed as though it was continuous without reasoning that this aids in understanding.
The second sets of visualisations involve the average cell dependency vectors. This data can be displayed in both 2 and 3 dimensions using the VisAD spreadsheet.
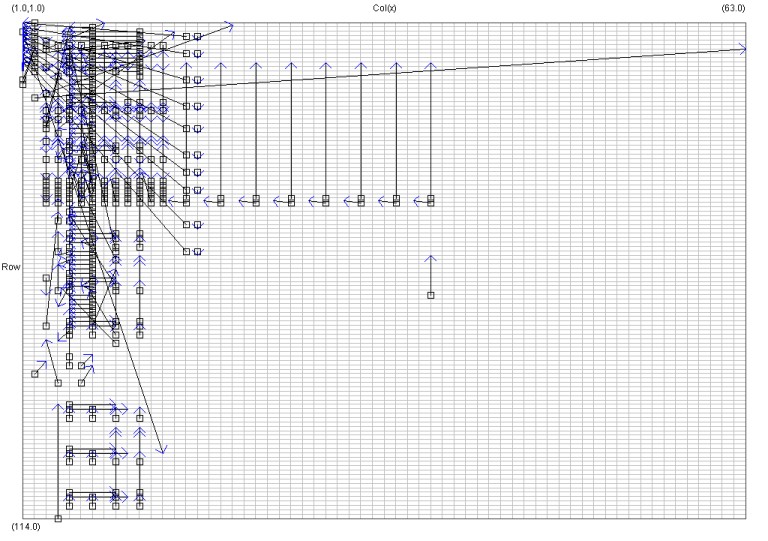
The most recent image to be generated uses the average magnitude cell dependency vector starting at the origin for each worksheet. The patch wheels in [PVVP] inspired this image.
A current limitation in using VisAD is that the magnitude of vectors displayed is proportional but not equal to the actual vector magnitude. To address this I have started producing my own Java based vector visualisation tool - DVector.
5. Screenshots
Images and screenshots are available through the web page at http://www.mcs.vuw.ac.nz/~elvis/db/gallery.html.

Figure 2: The total cell occupancy levels for 15 workbooks.
Figure 2 comes from VisAD in 3D mode. The data being displayed comes from Analyser counting how many worksheets occupy (have some from of value) a certain cell.

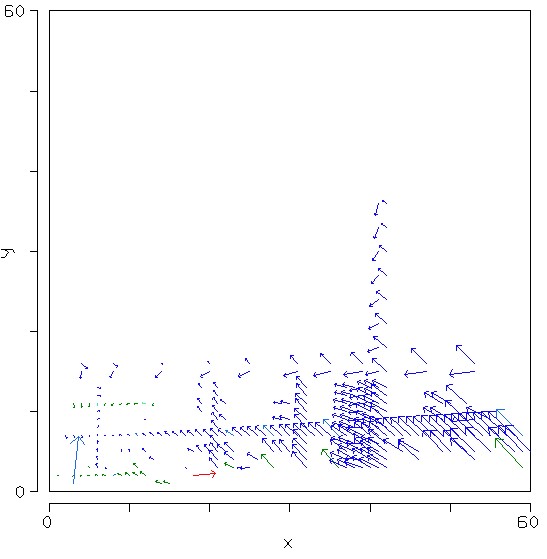
Figure 3: Average Cell Dependency Vectors for 15 workbooks
Figure 3 shows the average dependency vector for each cell, averaged over 15 workbooks. The colours come from the average depth of the worksheet.

Figure 4: Average Cell Dependency Vectors for 15 workbooks.
Figure 4 is displaying the same style of analysis as Figure 3 except using DVector. It should also be noted that the spreadsheets being analysed are different.

Figure 5: The Average Dependency Vector for each Worksheet.
Figure 5 shows the average dependency vector for each worksheet where the starting point for all the vectors has been set to the origin.
6. Future plans
6.1 Cross Platform Java Components
Something that is beginning to become an issue with my development technique is support for operation of a variety of operating systems. Currently, due to Extractor using native code, Windows is the only operating system to be able to run the entire process on. The current solution for doing experiments at university is to run within the WinCenter environment and add a user environment variable to put the ExcelAccessor DLL in the system path. A separate user environment variable (CLASSPATH) is also added to include the Java runtime libraries for required packages. Alternatively, the stand-alone Windows NT box in the graduate labs can be used with the Unix file system loaded through a mounted network drive.
6.2 Metrics for Spreadsheets
One concept that seems to hold promising potential is the use of metrics to show supplementary information in the visualisations. I was first made aware of this concept in reading [LAN 01a]. I will endeavour to research into existing metrics for spreadsheets. Also of interest in this paper was the ability to categorise the resulting visualisations.
6.3 A Set of Visualisations
After reflecting on the research undertaken into spreadsheets and visualisation I will attempt to come up with a set of visualisations that can be applied to the corpus to look for interesting properties and occurences. These visualisations should be targeted at interesting properties yet be relatively simple to understand.
6.4 Large Scale Testing
The following relates to phase 8 - Do a full scale run to produce completed diagrams using all spreadsheets of the project proposal.
Once the software and process I have developed is stable and mature enough, I will begin testing of larger corpuses. Currently only small-scale tests have been carried out on samples of 15 to 20 spreadsheets.
Special consideration may have to be made for the storage location of a large corpus. It may not be possible to store large volumes of spreadsheets on the standard Unix shared drives at university.
As pointed out above, the opportunity to look for categorisations is promising and may yield interesting information.
7. References
[CL-Ed] Tony McEnery,
Andrew Wilson (1996).
Corpus Linguistics, Edinburgh Textbooks.
[EA] ExcelAccessor,
IBM Alphaworks.
http://www.alphaworks.ibm.com/ab.nsf/bean/ExcelAccessor
[GWAPI] (2002).
Google Web APIs, Google.
http://www.google.com/apis/
[LAN 01a]
Michele Lanza, Stéphane Ducasse (2001).
A Categorization of Classes based on the Visualization of their Internal
Structure: the Class Blueprint, OOPSLA 2001.
http://iamwww.unibe.ch/%7Elanza/Publications/PDF/oopsla2001.pdf
[NC] Noam Chomsky.
http://web.mit.edu/linguistics/www/chomsky.home.html
[PVVP] James Noble,
Robert Biddle. (August 2001).
Program Visualisation for Visual Programs, Victoria University of Wellington.
http://www.mcs.vuw.ac.nz/comp/Publications/CS-TR-01-6.abs.html
[REJava] Regular
Expressions for Java, GNU (21/10/2001).
http://www.cacas.org/java/gnu/regexp/
[RFC1945] Tim
Berners-Lee, Roy T. Fielding, Henrik Frystyk Nielsen (May 1996).
RFC 1945 -- Hypertext Transfer Protocol -- HTTP/1.0, IESG.
http://www.w3.org/Protocols/
[RIV] Stuart K. Card,
Jock D. MacKinlay (ed), Ben Shneiderman (ed) (May 1999).
Readings in Information Visualization : Using Vision to Think. 1-558-60533-9
[SOG] Jacques Bertin
(1967).
Semiology of Graphics, The University of Wisconsin Press. 0-299-09060-4
[VVP] James Noble,
Robert Biddle. (2001).
Visualising 1,051 Visual Programs -Module Choice and Layout in the Nord Modular
Patch Language, Australian Computer Society, Inc.
http://www.jrpit.flinders.edu.au/confpapers/CRPITV9Noble.pdf
[VisAD] Bill Hibbard.
VisAD, Java component library , Space Science and Engineering Center
- University of Wisconsin - Madison.
http://www.ssec.wisc.edu/~billh/visad.html
7.1 Web site references:
Project home page:
http://www.mcs.vuw.ac.nz/~elvis/db/honours.html
The project proposal:
http://www.mcs.vuw.ac.nz/~elvis/db/proposal.html
Information on corpus analysis:
http://www.mcs.vuw.ac.nz/~elvis/db/FishBrainWiki?Corpus
Screen shoots from components:
http://www.mcs.vuw.ac.nz/~elvis/db/gallery.html
The software structure:
http://www.mcs.vuw.ac.nz/~elvis/db/structure.html
8. Glossary
Corpus:
[CL-Ed]. "(i) (loosely) any body of text; (ii) (most
commonly) a body of machine-readable test; (iii) (more strictly) a finite collection
of machine-readable text, sampled to be maximally representative of a language
or variety "
Empiricist Analysis:
[NC] "An empiricist approach to language is dominated
by the observation of naturally occurring data, typically through the medium
of the corpus."
An alternative to empiricist analysis is to use a rationalist theory.
Rationalist Theory:
[NC] "A rationalist theory is a theory based on artificial
behavioural data, and conscious introspective judgements."
